Basic Tutorial for Control System (III)

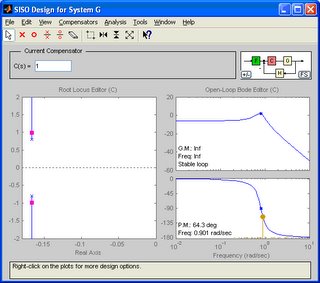
The graphic user interface (GUI) come with the control system toolbox makes the learning process faster and easier.
>> sisotool(G);

If you don’t have the transfer function object “G” yet, please refer to Basic Tutorial for Control System (I) on how to do so.
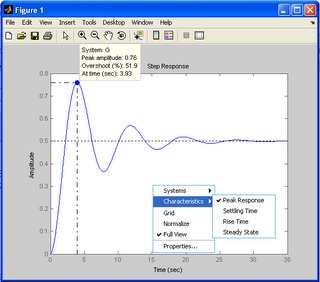
The “pink color” dot is the closed-loop poles location. Dragging the dots yield the changes of gain for the system. The good thing of this GUI is that we could view the step response updated “live” when we drag the closed-loop poles. It gives us a good view on how the changes of gain affect the system step response.
There are more things that we could do with this GUI, just explore and see it yourself!


